Monday, July 25, 2016

Creating Rubrics for Performances Tasks Aligned to NGSS – Part 1

Evaluating current efforts to move science education forward, such as that framed by the Next Generation Science Standards, requires “assessments that are significantly different from those in current use” (National Academies report, Developing Assessments for the Next Generation Science Standards, 2014). Performance tasks in particular offer significant insights into what students know and are able to do. “Through the use of rubrics [for such tasks] … students can receive feedback” that provides them a “much better idea of what they can do differently next time” (Conley and Darling-Hammond, 2013). Learning is enhanced! Building from a vision of the skills and knowledge of a science literate student, rubrics can allow students (and other educators) to see a clearer path toward that literacy.

Of course, using rubrics with performance tasks is generally a more time-intensive process than creating a multiple-choice or fill-in-the-blank exam. In order to be used as part of a standardized testing system or as reliable common assessments, scoring these types of tasks requires more technical considerations:
  • Tasks must include a clear idea for what proficient and non-proficiency looks like; 
  • Scoring must involve multiple scorers who all have a clear understanding of the criteria in the rubric; and, 
  • Designers need to develop clear rubric descriptors and gather multiple student anchor responses at each level for reference.
Often, when teachers grade student projects or other performance tasks on a rubric, it looks something like this (click for larger image/pdf):
While this example comes from a 4th grade classroom, secondary rubrics often have similar characteristics.

Considering alignment to the NGSS, and effective rubric qualities in general, there are several changes I’d make:
  1. What’s the science learning involved? They appear to be drawing or making a model. About what? What understanding would a proficient model of that phenomenon display?
  2. What would mistakes look like in a model? I’m a little worried that the “model” here is just memorizing and recreating a diagram from another source. Students’ models should look different. There might be a mistake in not including a key element of a model to describe the phenomenon, or not noting a relationship between two of those elements. Types of mistakes indicating students aren’t proficient should be detailed. 
  3. Neatness and organization are important, but I question the use of those terms as their own category. I would connect that idea to the practice of scientific communication. Does the student clearly and accurately communicate his or her ideas? Do they provide the necessary personal or research evidence to support their ideas? The same is true within the data category. I’m more concerned about whether the students can display the data accurately and explain what the data means, than whether they use pen, markers, and rulers to make their graphs…
  4. It’s not a bad idea to connect to English Language Arts (ELA) standards—done here with the “project well-written” category. At the elementary level in particular that makes sense; however, I’d want to ensure that I’m connecting to more, actual ELA standards, such as the CCSS ELA anchor standards for writing, which emphasize ideas like using relevant and sufficient evidence. At upper grades, I’d also want to emphasize disciplinary literacy in science (e.g., how do scientists write?) over general literacy skills.
  5. This rubric actually does better than many at focusing on student capacity rather than behaviors. I see many rubrics that score responsibility and on-task time, rather than scientific skills and understanding. Check out Rick Wormeli’s ideas. 
  6. What does “somewhat” really suggest? Is the different between two mistakes and three mistakes really a critical learning boundary? I see a lot of rubrics that substitute always, sometimes, and never for a true progression of what students should know and be able to do. I also see many rubrics that differentiate rankings by saying things like no more than two errors, three to five, errors, more than five errors. What do we really know from that? What types of errors are made? Is it the same error multiple times? What exactly can’t the student do in one proficiency category vs. the next? I really can’t tell by just saying two vs. four errors.
  7. Use anchors for clarity – this rubric notes that models are “self-explanatory” and that sentences have “good structure.” Do students really know what that means? Have they seen and discussed a self-explanatory model vs. one that is not self-explanatory? If there is space, an example of a model or sentence meeting the standard could be embedded write into the rubric in the appropriate column. If there isn’t a space, a rubric on a Google doc could link to those types of examples.
Looking around, really looking, I have found very few rubrics that make an attempt to align to the NGSS. I suspect some people are still nervous about sharing. In my next blog post, I’ll share an NGSS-aligned, three-dimensional rubric I created and detail the process involved. I’ll also share some resources from other groups tackling this work. 

Monday, July 18, 2016

Formative Assessment and the NGSS – Part 2

A new colleague here at the Wisconsin Department of Public Instruction, Lauren Zellmer, read through my last blog on formative assessments. Her question was, “What specifically do teachers do with the information once they’ve conducted these formative assessments?” Great question! I decided to write a Part 2 of the formative assessment blog, where I’ll share a few more details for possible instructional next steps based on hypothetical results.

First teacher – Rubric on modeling

In the first example, the teacher collected whole-class and individual information using a modeling practice rubric, as he walked around asking probing questions and jotting down student names across the rubric continuum. After some reflection in pairs, he had a few students share their models in order to highlight key aspects of the practice, which will help build capacity in all students. Depending on students’ level of understanding, further support might include the following:
  • If he found that most students did not fully understand this element of modeling (mostly 1’s and 2’s), he could provide scaffolded modeling instruction in the next part of the lesson requiring modeling. He would prepare a modeling handout which lists possible elements of the model and requires students to note whether to include those aspects and why. Students already proficient would complete models without that scaffold. 
  •  If he found that understanding is fairly varied (largely 2’s and 3’s, with some 1’s and 4’s), the teacher could provide further time for group reflection and sharing. That further reflection would best happen immediately—after a few, selected groups shared elements of their models, the class could get back in pairs to improve their models based on those ideas. And, next time modeling occurs in a lesson, the teacher could repeat a similar in-depth process, like the first time, to continue to provide significant support. 
  •  If he found that most students proficiently performed this aspect of the practice (largely 3’s, with some 2’s and 4’s), he could make a note of which students are still struggling. The next time modeling happens, instead of moving around the class generally to assess where students are at, he could narrowly focus his support and questioning on those students. He might provide them some in-depth small group help, with scaffolds provided. He could also pair them with proficient students where he knows they won’t just be given answers, but meaningfully supported in their learning.
Second teacher – Testable questions
In the second example, the teacher had students write questions about biodiversity while on a nature walk, thus collecting whole-class and individual information on whether students could write testable questions. The next day, with the whole class, she shared useful “yellows,” where students’ questions needed more work, and “greens,” where students’ questions were testable. She also made some notes in a file as to where the class seemed to be overall with this skill. Depending on students’ level of understanding, further support might include the following:
  • If she found that most students could not write a testable question (lots of “yellow”), she should do more than read through notable yellows and greens. After that review, students could receive more practice in a guided, whole class discussion, evaluating a series of questions, noting whether or not they’re testable, and fixing them to make them testable. Then, she could ask students in small groups to collaboratively revise their questions to make them testable. These groups would include a student who did proficiently demonstrate this skill where possible. 
  • If she found that about half could write testable questions and half could not, I would again suggest she have students rewrite their questions in small groups. For students still struggling after a round-two attempt, she could support them in a small group with an activity like that noted above (evaluating examples together). The remainder of the students might begin some independent research or brainstorming on the design of the investigation to answer their questions. 
  • If most could write testable questions, she might provide individual help to students still struggling with their questions after the discussion of the greens and yellows. Those students could use the reviewed questions as models to revise their own, with the teacher ensuring they can explain why their original ideas were not testable.
Formative assessment is “assessment for learning”. Teachers need specific ideas as to what strategies they’re going to implement depending on the results of the formative assessment. They also need some way to record progress, not only relying on “gut feelings” and memory (my brain and gut, at least, aren’t that reliable). Having some class assessment notes on a page or a rubric can be a quick means to do so.  Finally, coming together with peers to discuss the data and possible strategies is critical to moving forward as a science department (and community).

Wednesday, June 1, 2016

Formative Assessment and the NGSS

Within this post, I am going to focus on formative assessment as an ongoing assessment conducted as part of daily instruction to guide further instruction. They are informal or formal checks of knowledge happening in conjunction with instruction. I’m not considering more summative type assessments such as end-of-unit tests or student projects. Though to be sure, all assessments should be formative, in that the results will be used to guide decision-making in relation to instruction.

Therefore, formative assessments probably won’t be the primary tools that teachers and administrators will look at when determining whether their school as a whole is making progress toward their vision for science education. Instead, they are tools that will influence daily decisions in the classroom, as well as student and/or teacher collaborative conversations. Do I need to provide more time for peer discussion around crafting a procedure for their investigation? Should I include more scaffolding for students to create an effective data table? Notably, they might inform elements reported on a standards-based report card, but more often they will not.

In a classroom using the NRC Framework and/or the Next Generation Science Standards, educators aim to use three-dimensional instruction, including within formative assessment. Two examples of what that could look like in practice might help:

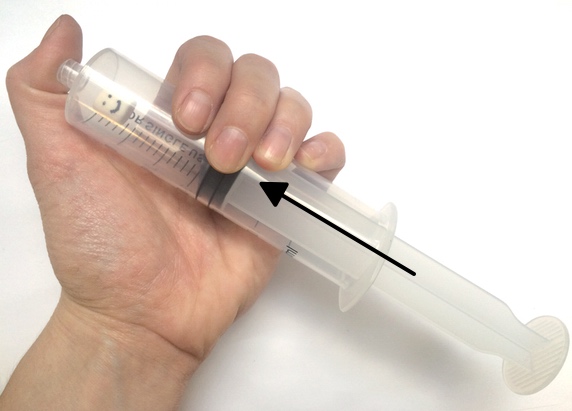
A fifth grade teacher shows students a large syringe full of air. He asks them to discuss with a neighbor what will happen if he plugs the end and pushes down. Students then get to try it out at their table. After a couple minutes of students investigating the phenomenon, the teacher asks them to model the phenomena by drawing a diagram of it, prompting them to consider how to show things they can and cannot see. Why does it get harder to push down? Students create the model on their own first, then discuss their model with a peer, making revisions to their models as desired and considering evidence. The teacher walks around asking probing questions such as, “What are those little circles in your syringe?” “Are they really that big?” “How do they look different before and after pushing down on the syringe?” As he walks, he’s jotting down student names and occasional notes along the continuum of the rubric, which he has on a tablet or clipboard. Students then discuss their models in relation to the portion of a modeling rubric focused on clearly representing all important aspects of the phenomenon (not yet relationships among components). The teacher walks around, looking and listening for important components of models, evidence, and comments to share with the class to illustrate this aspect of modeling. He has a couple pairs of students share theirs, highlighting key criteria from the rubric where students appeared to be struggling. He also keeps his notes in a file with similar notes about students’ abilities with the science and engineering practices to look for progress over time and keep track of areas that need more work. 

Modeling - Subskill
1
2
3
4
Identifying important components of a scientific model
Student represents the object or occurrence
Student represents the object (etc.) with details (evidence) related to the phenomenon
Students models the phenomenon (etc.) in such a way that it adequately represents important components of it (and not extraneous elements) and evidence gathered
Student models the phenomenon, explains why those are the important components based on evidence, and can analyze why components noted in one model better represent the phenomenon than those in another model
In This Example
Student draws a syringe
Student draws a pushed down syringe with packed little circles inside of it and label of “gas”
Student draws one syringe pulled back and another one pushed down, each has a magnification “bubble” representing the scale of air particles and w/ them being closer together in the pushed down image
Student draws two syringes, as noted in 3, explains the importance of the scale and the particles being closer together, and notes why a model depicting air particles still far apart even with syringe down is more accurate (e.g. evidence – can’t see the air)

As a second example, a high school biology teacher asks students how many types of organisms there are in the world, leaving the question intentionally vague. Students discuss the answer in groups of three (no devices used at this point). The teacher pushes for justification and evidence for quantitative responses, as well as proper vocabulary. After a few minutes, she asks some student groups to share their answers and evidence. And, then she asks, “Why is this diversity of life important?” After sharing ideas with a partner, the whole class discusses it for a few minutes. The teacher then describes an investigation the class will do of “biodiversity” within their school grounds (as part of a larger unit on ecosystems, invasive species, and adaptations). The class goes on a quiet, mindful walk outside where students observe and come up with a testable question(s) about biodiversity on their school grounds and/or in the local area. At the end of the walk, the teacher collects the cards with students’ names and ideas on them. She quickly sorts them into yellow—needs more work, or green—testable; she also jots down some notes as to where students are at in general with this skill and adds it to her assessment file. The next day she anonymously shares a few of her favorite greens and yellows to illustrate key concepts in relation to testable questions, eliciting student ideas first in that conversation.

These formative assessments must be part of a larger cycle of guiding and reflecting on student learning. I like the APEX^ST model described by Thompson, et al., in NSTA’s Nov 2009, Science Teacher:

    APEX^ST model of collaborative inquiry - Thompson et al
  1. Educator teams collaboratively define a vision of student learning. 
  2. They teach and collect evidence of learning. 
  3. They collaboratively analyze student work and other formative evidence of learning (such as conversations) to uncover trends and gaps. 
  4. They reflect how opportunities to learn relate to evidence of student learning.
  5. They make changes, ask new questions, conduct another investigation, etc.

And, then they reflect again on evidence of student learning in light of their vision, considering changes to their vision and objectives as necessary.

One goal here, even in formative assessment, is to be thinking about how student learning fits into the overall picture of three dimensional instruction. Within the gas particle modeling task above, the science/engineering practice (SEP) is modeling, the disciplinary core idea (DCI) is 5-PS1.A—“gases are made from particles too small to see,” and the crosscutting concepts (CCCs) are cause and effect and scale. Within the biodiversity question task, the SEP is asking questions, the DCI is HS-LS2.C—“ecosystem dynamics,” and the CCC is systems and system models (though others could apply).

While those 3D connections are being made overall, the specific, in-the-moment, formative assessment goals here do not capture all three dimensions. In other words, the full task and work throughout the unit will involve students in all dimensions, but this formative snippet is really about one element of one practice in each case. Can students represent important aspects of a phenomenon within a model? Can students generate a testable question? The formative data gathered and acted on could also focus on their understanding of biodiversity or the particle nature of matter (DCIs). Or, it could focus on their ability to reason about the scale of a phenomenon (CCC). But, in this case the teacher kept things simple and more manageable with a specific, narrow goal in mind, which clearly related back to a larger vision for student learning and objectives for this unit. Importantly, while it’s a narrow goal, it’s still a deeper, conceptual learning goal. It’s not just an exit card asking students to regurgitate a fact or plug numbers into a formula.

Examples of assessments (not necessarily exemplars, could be formative or summative)

Formative assessment resources:

Other resources to add? Put them in the comments below!


Thursday, March 3, 2016

Using Surveys as Part of the Evaluation of School Science Programs

Surveys of students, teachers, and community members will provide critical information in the process of determining whether changes made to your science education program improve desired outcomes. Many important questions cannot be answered through typical science assessments. While it’s clearly essential that students understand and can do science, do they sincerely believe that someone like themselves could be a scientist? Further, are you changing not just knowledge of, but beliefs about, science? Do students see how science relates to their lives? Is it meaningful for them? Or, do they see a need to question “scientific evidence” within popular media?

A recent article in National Geographic noted that solid, research-based science often faces organized and angry opposition. We don’t want students leaving school doubting the consensus of the scientific community (unless they somehow have sufficient, valid evidence to doubt a claim). They can understand how vaccines work and still decide not to have their children vaccinated. It’s unfortunate that our society believes in science, but not its findings.

Furthermore, do students understand who scientists are and what they do? While it was created as a tool for K-5, the “Draw-a-Scientist” test (DAST) could be done at secondary levels as well. My 8th graders certainly held onto stereotypes of scientists. We want students to see science as including a wide-range of tasks by a wide-range of people, particularly people who look like them and have interests similar to their own.

Here are a few sample surveys of student attitudes: 

These surveys can provide teachers with data to evaluate their individual courses and the science program more generally.

While surveys of student outcomes are critical within a system of assessments, it’s also important to understand the views of parents/community members and teachers during the change process. Surveying parents and other community members can help ensure they’re aware of and meaningfully connecting to the school science vision and students’ science learning. Teacher surveys can ensure they’re comfortable teaching their content and the practices of science in accordance with the vision for science learning. Within results, you can look at trends by demographics, such as race and ethnicity, or differences between new and veteran teachers.

In a survey of parents and community members, you probably don’t want to get into the content being taught. Hearing about personal views of evolution and climate change isn’t necessary for these purposes. Questions could have a Likert-scale format, with selections from strongly agree to strongly disagree. Some examples include:
  • Through the science courses, I believe my student is becoming a better scientific thinker (for the broader community that would be rephrased as “students are becoming”).  
  • I am familiar with the district vision for science education. 
  • I believe my student is receiving a quality foundation in his/her science classes to pursue science careers in the future. 
  • I believe my student is being well-prepared for science classes at the college or university level.

There should also be an open-ended text box, asking survey takers to please share any comments or questions about the science education program at their school. Of course, even with community input, you’re not going to resort to poor instructional practice that isn’t research based, like lecture. Educators are the professionals in this setting. You may, however, decide to make more career linkages in your courses or bring in more guest scientists.

It’s also important to know where teachers are at in the change process. Are they getting the support they need in teaching science? Tools like the Survey of Enacted Curriculum (SEC) can also let educators and administrators know whether what they’re doing actually lines up with the intentions of the instructional program. It’s not a “gotcha” system, but an approach like Lesson Study that can lead to tremendous, collaborative professional learning.

A brief endnote… While it is true that for statistically-validated studies surveys need to undergo extensive testing, everyday school surveys can provide a useful piece of information for guiding instructional programs. Surveys linked above have largely undergone testing and include multiple item constructs, so using them or learning from them is a good step.

Some other tips for creating quality surveys include: 
  • Use multiple questions to measure each idea or topic. Looking at several questions together provides a more valid picture of what people really think.  
  • Have a student, parent, etc. verbally talk through their thoughts on the survey with you. They think aloud as they read and answer the questions. Are they understanding the questions in the way that was intended? Is there some confusing wording? Having people of different backgrounds do so helps ensure the questions are similarly interpreted by people. 
  • A focus group, with a neutral facilitator (i.e., not your boss), can provide a different perspective and bring out ideas that a survey cannot. It can also inform survey development.  
  • Pilot the survey before sending it out broadly. 
  • Here are a few further tips for online surveys.

And, yes, it takes extra time and effort to know whether you’re actually making a long-term difference for your students and whether the large-scale changes improve classroom practice, but it’s worth it. 

Monday, February 1, 2016

Science Program Evaluation and a System of Science Assessment

Assuming your district/school has established a vision for science education and large-scale, specific goals aligned to that vision, you will next need to determine a system of assessments for evaluating progress toward those goals. As mentioned in my last post, many districts are working to adopt and implement new science standards. Strategically assessing science-related outcomes at multiple levels will provide ongoing evidence of effective change – after all, why make changes if you don’t know whether they actually make any difference?

While it might be obvious, an evaluation of a science program based on these goals will take more than one assessment! In other words, the annual state standardized test, often the only systematic science test used by a school, will not measure the full range of outcomes related to a meaningful vision for science education. That requires leaders to strategically implement a system of assessments. The Wisconsin DPI has a chart that illustrates some components of such a system, including formative, interim, and summative elements.

The majority of assessment will happen formatively at the classroom level. This level is where teachers see the day-to-day use of scientific practices by their students as they investigate, communicate, and ask questions about science. It will be critical for teachers to have the structures to discuss what they’re observing from their students, collaboratively determining next steps. Processes of informal formative assessment should drive instructional practice. If schools are moving toward the NGSS or NRC Science Framework, formative, as well as all levels of assessment, should be three-dimensional.

 Common, interim assessments and rubrics across classrooms and grade-levels can support collaborative understanding of students’ abilities. These types of assessments can provide a more formal view into student growth in relation to science content knowledge and practice. Quality performance tasks can potentially provide the clearest information for collaborative groups of teachers to reflect on progress toward their goals. They need to be implemented well, however, in order to be useful. Teachers must have the time to score papers together and come to an agreement on how particular examples of student work meet the rubric criteria.

Large-scale district summative tests (or state level tests) often afford the least amount of data for specific instructional guidance. They might, however, suggest areas for professional development or foci for revised student project rubrics. For example, a set of district end-of-course exams might all show that students across the district struggle with using data effectively. Often these types of tests are multiple-choice, which provide limited information in relation to authentic science practice, but they can be effectively paired with open-ended opportunities for students to describe their reasoning.

An often forgotten element in such an assessment system is an evaluation of student attitudes about science and their general scientific literacy. Do they see how science relates to their lives? Can they make sense of scientific evidence within popular media? Is science meaningful for them?

In summary, schools and districts reviewing and attempting to improve their science programs will have unclear success in that process if they haven’t defined what outcomes they want and how to measure them. A meaningful and strategic system of science assessment will be an essential part of this process. 


The next series of blog posts will discuss formative, interim, and summative assessments in more depth, as well as effective surveys of student attitudes. Each will provide examples of these assessment types and suggestions for classroom or school use. 

Tuesday, January 12, 2016

Science Program Objectives

After a focus on disciplinary literacy in the last couple of posts, I’m now returning to the theme of science program review/revision…

I’ve spoken to several districts in the last few months that have established a vision for science education. That excites me a lot! Talking to them further, I often ask how they’re going to measure whether or not they’re achieving that vision. They share their 3-5 year plan with me for revising their science program, and I ask, “How will you know in 3 to 5 years whether you’ve made progress in accomplishing your vision?” Many leaders have no answer to that. Supporting administrators and educators in establishing that evaluation plan is, therefore, the purpose of this post and others to come.

In order to create that evaluation plan, the school/district science leadership team will first need to translate their vision statement into specific and measurable objectives. These are the big picture goals of science for the students. They’re more concrete than the vision but less specific than the more content-related learning objectives that would be part of a standards-based report card (I’ll describe those objectives in a later post). Ideally, these goals will be written out as SMART goals, meaning they are:

  • Specific: Clearly states what will be done. 
  • Measurable: Links to a particular outcome using a specific test, noting a particular target. 
  • Achievable: Want it to be a stretch, but realistic. 
  • Results-focused: Should measure student outcomes, not program implementation. 
  • Time-bound: Have a due date. 

To craft a couple examples of SMART goals, let’s take a few phrases from the initial vision I shared in this blog from the NRC Framework for K-12 Science:

“[By] the end of 12th grade, all students have some appreciation of the beauty and wonder of science; possess sufficient knowledge of science and engineering to engage in public discussions on related issues …” 

Starting with the first phrase, I’ll turn it into a SMART goal. Let’s say I’m working with a group of middle school teachers.

By the end of their 8th grade year, all of our students will express an appreciation of the importance of science in their lives and a sense of wonder in relation to science, as measured by answering “somewhat agree” or higher on the relevant questions of the Science Attitudes Survey.

The goal is specific. There is a particular outcome wanted for all students. The goal is measurable. The school will be using specific questions on the Science Attitudes Survey, with a ranking of at least “somewhat agree” on those questions (note: I’m not referencing a specific survey here, though there are several available). The goal might be achievable. Science programs and goals should be for ALL students, but will all students really agree with statements about the sense of wonder inherent in science? That’s less certain. After the first year of data collection, having an established baseline will allow for more realistic goals. The key will be continuing to have high expectations for all and pushing on what might be considered “realistic.” The goal is results-focused. It’s not just that teachers will have more engaging activities. It’s focused on an outcome, student engagement in science, where they’re seeing its meaning related to themselves. The goal is time-bound. It’s by the end of 8th grade. As a middle school team, goals could be annual, semi-annual, or by unit, but if it’s collaborative work as a department, having a goal for the end of their three years with you would also make sense.

Here’s another example of a SMART goal, linked to the second phrase in the vision statement:

By the end of the year, all of our students will increase performance task scores by at least one point in each category of the claims, evidence, and reasoning rubric. Three times each year we will use this rubric with performance tasks to measure their ability to communicate claims supported by evidence, with clear scientific reasoning.

A lot of important goals will not be measurable on a standardized test! Staff could create a series of performance tasks requiring students to make a substantiated claim for a particular action their community should take in relation to a particular phenomenon that they studied (pollution, erosion, habitat destruction, etc.).

The goal is specific. There is a clear outcome noted for all students. The goal is measurable. The school will be using common performance tasks, and students’ growth on those tasks, based on a rubric is spelled out. Again, it’s unclear whether the goal is achievable, but we want all students to learn through the year, and moving up one rubric category might not be rigorous enough (notably, such a goal might not be relevant to some students already scoring at the top). The goal is results-focused. It’s focused on an outcome, student performance on specific tasks requiring communicating and defending scientific ideas. The goal is time-bound. Each teacher would expect to see progress by the end of the year.

Of course, the science department will need to come together regularly to look at data in relation to these big-picture goals. Conversations should likely be happening at least weekly in relation to student work and how particular formative or interim assessment data could inform instruction. Those weekly conversations would focus on more particular goals, likely those in standards-based grading. But, at least a few times per year (beginning/middle/end), teachers should be coming together to talk about progress in relation to these big-picture goals. Thompson, et. al., describe a process for this type of collaborative work. Selecting one of these goals per year can provide a focus for teacher collaboration and professional development. A science program does not have to be reviewed in relation to every one of the goals every year.

The next blog post will provide more specific guidance on the evaluation of science program in relation to these goals through a “system” of science assessment.

Tuesday, September 1, 2015

Two Annotated Lessons to Show How Concepts of Literacy Might Continually Intersect in a Science Classroom

Building on my previous post (a must read before this one), I describe two lessons here, labeling the literacy components of each lesson. For reference, connections to literacy strategies (L), disciplinary literacy (DL), and scientific literacy (SL) are labeled within the descriptions of the lessons below. Because each reference to disciplinary literacy (DL) would also be a reference to scientific literacy, for clarity it’s only labeled as DL (not as SL too). 

Elementary
In a kindergarten classroom, a teacher puts a stuffed animal on a rolling chair in front of the room. The teacher asks, “How could we make ‘Stuffy’ move? Share an idea with a partner” [DL]. She then circulates to hear student talk [L]. She randomly asks a few students to come describe and demonstrate their method [DL]. As students share their method, she’ll be pointing out terms they use, particularly highlighting or prompting the terms push and pull. Next, she has students write in their science notebooks, “A force is a push or a pull” [L]. This writing may be scaffolded by having some students just trace these words on a worksheet glued into the notebook [L]. Above that writing, she asks students to draw a picture of their idea, or another pair’s idea, for how to move the animal [DL]. Some student pairs that haven’t shared yet are then given the opportunity to share and explain their drawing [DL]. Students are specifically asked to explain, “What is causing the force in your picture?” [SL]. 

For homework, students are asked to somehow show their parents a push and a pull and tell them that a push or a pull is a force [DL]. For accountability, parents could help students write or draw about what they did, or students would just know they would have to share the next day.
In class the next day, the teacher asks students to share some of the pushes and pulls they showed their parents, asking them to use the word force [DL]. She then asks students to talk with their partner about, “Why did the animal in the chair sometimes move far and sometimes not move as far when we added a force?” [SL]. She then asks some students to demonstrate and describe an idea for making the animal/chair more far or less far; ideally, students will push or pull with varying degrees of force [SL]. Students are then asked to write in their notebooks, “A big force makes it move more!” [L] With a teacher example as needed, they also draw an image of what this might look like [DL]. 

As a possible extension: how would a scientist decide for sure which went further? How would she measure it? The class could discuss and perform different means for measurement, standard and nonstandard [SL].

Middle School
Student groups begin with a set of rocks and crystals at their table. The teacher asks them to generate a set of science-related questions in relation to them, noting those questions in their notebooks [SL]. Each group shares one of their questions, looking for one that’s different from other groups and adding new ideas they like to their list [L]. The teacher then asks students to observe the rocks and crystals with a goal of generating a list of characteristics based on/related to those patterns [SL]. Groups share how they’ve characterized the rocks, adding interesting new ideas shared to their own lists [L]. Tools such as microscopes or magnifying lenses will be useful in their observations [SL]. 

Students next read an article on rock and mineral types, including characteristics of those rocks and minerals [L]. The teacher asks them to specifically find information on characteristics of the rock types that relate to or are similar to the list of characteristics (groupings) that they’ve generated [DL]. Finally, groups of students put their rocks into groups based on the categories and characteristics provided in the text, providing written rationale and evidence for why each rock would be placed within each group [DL]. 

Extension: Before reading the text, the teacher could also elicit background information and use characteristics generated by students to have them predict what types of processes would have been required to create these rocks and crystals, with the given characteristics [SL]. One possible question, “What do you observe about the rocks that makes you think different processes might have been involved in forming and shaping them?” Further, they could model and investigate where the energy involved in creating the rocks came from, linking processes with types of energy (such as gravity providing the energy for erosion due to water or the thermal energy of earth’s core providing energy for metamorphosis of rocks and creation of crystals) [DL and SL]. 

Concluding Thoughts
As I labeled the literacy facets of these lessons, I more fully realized how integrated these components should be in a classroom all the time. Effective science instruction constantly: 1) supports the literacy work that students do (L), 2) as it encourages them to interact with text like scientists (DL), 3) while they engage in meaningful scientific thinking and practice (SL).